
Once you've implemented event tracking in Google Analytics 4, the next step is to transform that data into actionable insights through effective reporting. This guide will show you how to build custom dashboards and reports that go beyond GA4's standard reports.
Understanding GA4's Exploration Reports
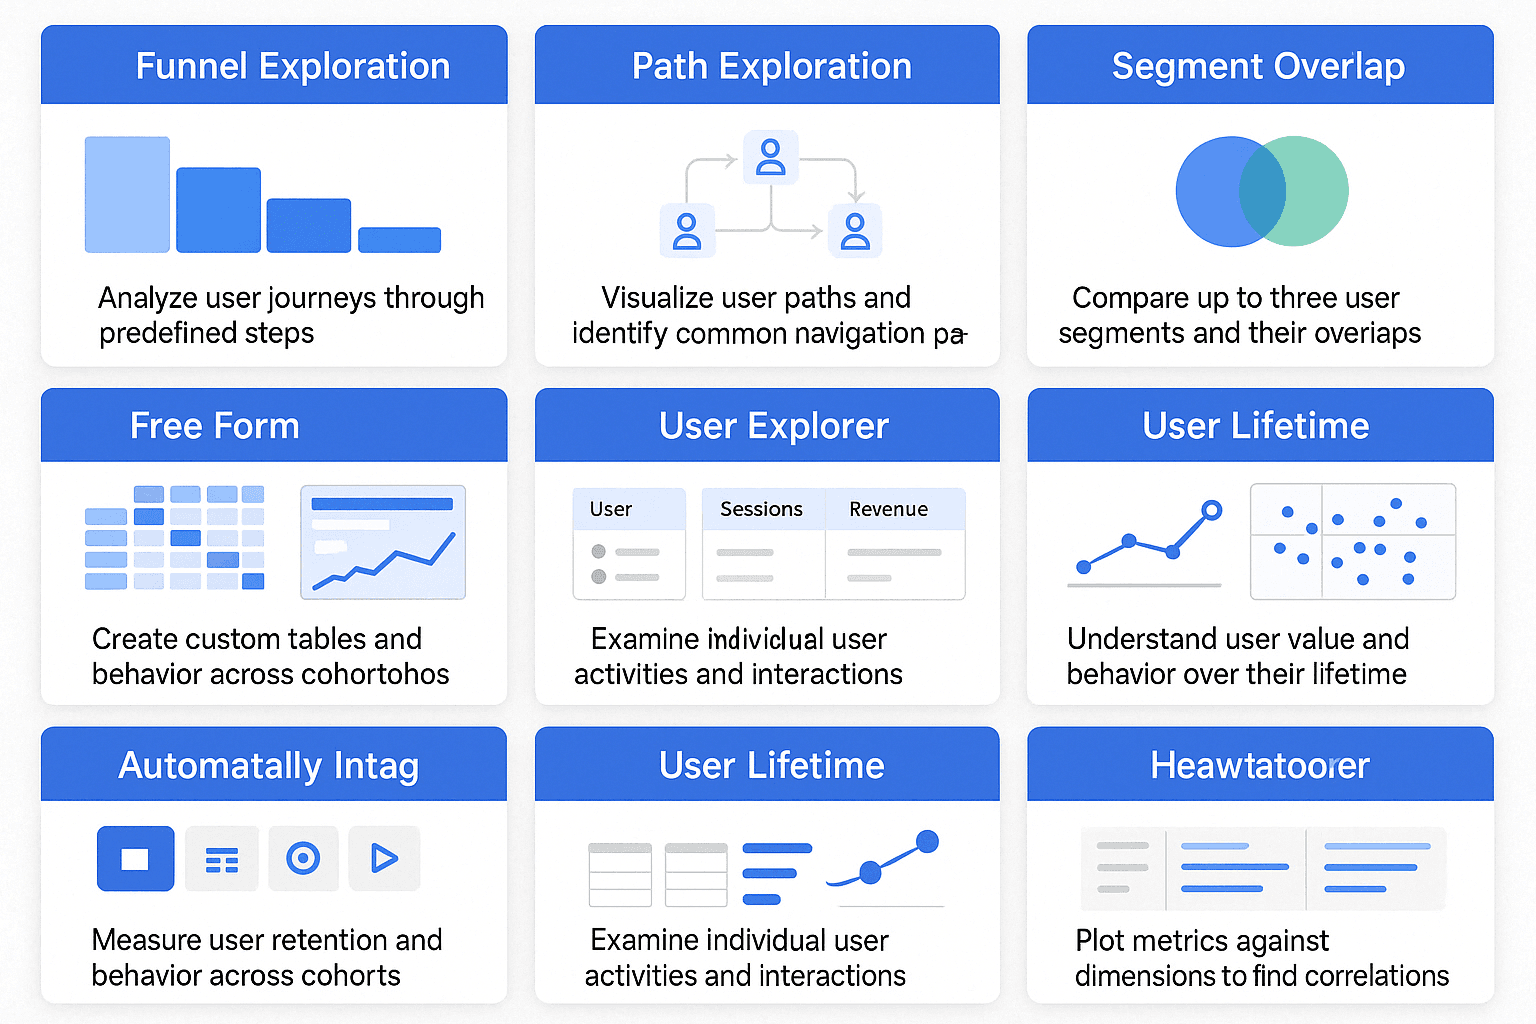
GA4's Exploration reports provide powerful tools for analyzing your event data:
Types of Exploration Reports
GA4 offers several report types for different analysis needs:
Free Form Exploration: Drag-and-drop interface for customizable reports
Funnel Exploration: Visualize conversion paths and drop-off points
Path Exploration: Track the sequence of pages and events users take
Segment Overlap: Compare different user segments with Venn diagrams
User Lifetime: Analyze user value and engagement over time
Cohort Analysis: Track groups of users who share common characteristics
User Segment: Create detailed audience definitions for analysis
Creating Your First Custom Report
Let's start by building a basic event analysis report:
Free Form Exploration Example
In GA4, navigate to Explore in the left menu
Click the Free form template
In the Variables tab on the right:
Add "Event name" as a dimension
Add "Event count" and "Total users" as metrics
Drag "Event name" to the Rows section
Drag "Event count" and "Total users" to the Values section
Apply date range and any necessary filters
[GUIDED DEMO: Building Your First GA4 Exploration Report] Video Description: A 5-minute walkthrough of creating a custom event analysis report in GA4's Exploration section. The screencast begins at the GA4 homepage and shows clear navigation to the Explore section. With deliberate cursor movements, the demonstration shows how to select the Free Form exploration template, then add dimensions and metrics to the report. The video highlights how to customize the report layout by dragging elements to different sections, applying filters to focus on specific events, and changing visualization types. The demonstration includes adding calculated metrics (like conversion rate) and applying segments to compare different user groups. The video concludes by showing how to save the custom report and share it with team members, with all cursor movements clearly visible and important UI elements highlighted.
Advanced Funnel Analysis for Events
Create custom conversion funnels to analyze user journeys:
Building an Event-Based Funnel
Start a new Funnel exploration
Add the following steps (customize based on your events):
Step 1: Event name = page_view (for homepage)
Step 2: Event name = click (for product clicks)
Step 3: Event name = view_item (for product detail views)
Step 4: Event name = add_to_cart
Step 5: Event name = begin_checkout
Step 6: Event name = purchase
Customize the funnel:
Make steps optional or required
Set time constraints between steps
Add segment comparisons
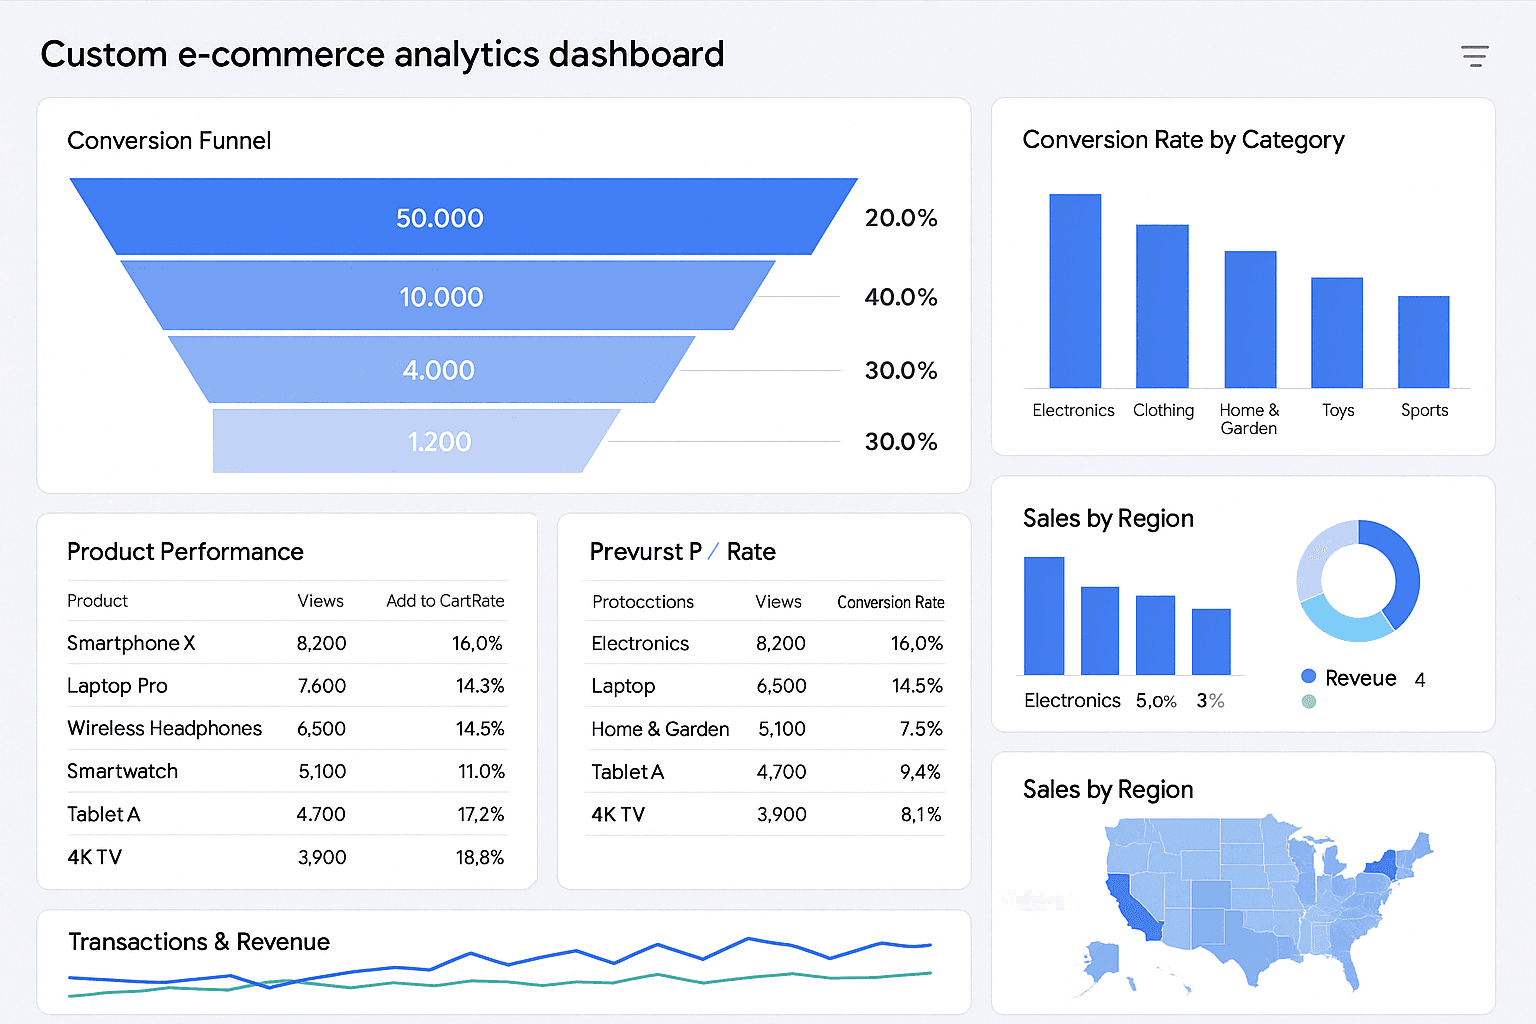
[IMAGE: Event Funnel Analysis] Description: Create a detailed visualization of an event-based conversion funnel analysis. Design the image as a GA4 funnel exploration report showing a complete e-commerce conversion path. The funnel should start wide at the top with "Page View: Homepage" (showing perhaps 10,000 users), then narrow through subsequent stages: "Product Click" (perhaps 5,000 users), "Product View" (3,000 users), "Add to Cart" (1,500 users), "Begin Checkout" (800 users), and finally "Purchase" (500 users). Each stage should be a different color with clear percentage drop-offs labeled between stages. On the right side, include a segment comparison panel showing how the funnel performs for different user types (e.g., "New Users" vs "Returning Users" vs "Subscribers") with differently colored lines showing their respective conversion rates. Below the main funnel, add a "Time Between Steps" section showing the average time users spend between each funnel stage. The visualization should look professional and data-rich, similar to what a marketing analyst would actually use when analyzing conversion paths in GA4.
Custom Event Segments for Deeper Analysis
Create segments to compare different user behaviors:
Event-Based Segment Examples
Power Users Segment:
Users who triggered specific events more than X times
Example: "video_complete" event count > 5
Engaged Readers Segment:
Users who reached 90% scroll depth on more than 3 pages
Comparison Shopping Segment:
Users who viewed more than 5 products but haven't purchased
Creating a Custom Segment:
In your exploration, click the "+" next to Segments
Name your segment (e.g., "Power Video Viewers")
Add condition: Event name = video_complete
Set threshold: Event count per user > 5
Save and apply to your report
[GUIDED DEMO: Creating Powerful Event-Based Segments] Video Description: A 4-minute technical demonstration showing how to create advanced event-based segments in GA4. The screencast begins in the GA4 Exploration section and shows the process of creating a new user segment. With clear cursor movements, the video demonstrates how to build segment conditions based on event data, including combining multiple event conditions (such as users who completed videos AND downloaded content). The demonstration shows how to set thresholds for event frequency, recency, and value, with each option clearly highlighted. The video then applies the newly created segment to different report types to show how it can be used for comparison analysis. The screencast concludes with saving the segment for future use and demonstrating how to access the segment library, with all important UI elements and options clearly visible.
Custom Calculated Metrics
Create advanced metrics beyond what GA4 provides by default:
Example Calculated Metrics
Engagement Rate:
{{Engaged Sessions}} / {{Sessions}}
Video Completion Rate:
{{video_complete}} / {{video_start}}
Add-to-Cart Rate:
{{add_to_cart}} / {{view_item}}
Event Value Per User:
{{Event Value}} / {{Total Users}}
To Create a Calculated Metric:
In your exploration, click "+" next to Metrics
Name your metric (e.g., "Video Completion Rate")
Create the formula using available metrics
Format the result (percentage, decimal, etc.)
Save and add to your report

Visualizing Event Flow and User Journeys
Understand the sequences of events that users trigger:
Path Exploration for Event Sequences
Start a new Path exploration
Set up your path analysis:
Node dimension: "Event name"
Start node: Select your initial event (e.g., "session_start")
Optional: Add segment comparisons
Analyze the resulting path visualization to see common event sequences
This analysis reveals how users naturally move through your site and which event sequences are most common.
Implementation Tip: When setting up path exploration, consider adding a "Page title" or "Page location" node after important events to see which pages those events occur on.
Custom Reports for Specific Event Types
Different events require different analysis approaches. Here are some specialized reports for common event types:
Form Interaction Analysis
Create a Free form exploration
Add dimensions:
"Event name" (filtered to form events)
"Page title" where forms appear
Form field parameters (custom)
Add metrics:
Event count
Form abandonment rate (calculated)
Average form completion time (custom)
Create visualizations:
Bar chart of form submission rates by page
Table of abandonment by form field
Line chart of submissions over time
[GUIDED DEMO: Form Performance Analysis Dashboard] Video Description: A 5-minute screencast demonstrating how to build a comprehensive form analysis dashboard in GA4. The demonstration begins by showing how to identify form-related events in your data. With clear cursor movements, the video shows the process of adding relevant dimensions and metrics to analyze form performance, including field-level abandonment tracking. The screencast then demonstrates how to build visualizations that reveal which form fields cause the most drop-offs, which forms have the highest completion rates, and how form performance trends over time. The video includes creating calculated metrics for form conversion rate and showing how to apply segments to compare form performance between different user types (mobile vs desktop, new vs returning). All clicks and interface interactions are clearly visible with slight pauses at key configuration steps.
Video Engagement Dashboard
Create a Free form exploration
Filter to include only video-related events
Add dimensions:
"Video title" parameter
"Progress percentage" parameter
Add metrics:
Play count
Completion rate
Average view duration
Create visualizations:
Funnel showing drop-off at each progress percentage
Bar chart comparing videos by engagement metrics
Heat map of peak viewing times
E-commerce Event Analysis
Create a Free form exploration
Include relevant e-commerce events:
view_item
add_to_cart
begin_checkout
purchase
Add product-specific dimensions:
Item category
Item name
Price tier (custom dimension)
Create visualizations:
Conversion funnel by product category
Table of top-performing products
Comparison of conversion rates by price tier
Cross-Platform Event Analysis
Analyze how events differ across devices and platforms:
Device Comparison Report
Create a Free form exploration
Add dimensions:
"Event name"
"Device category"
Add metrics:
Event count
Conversion rate (calculated)
Create visualizations:
Comparison bar chart of event counts by device
Heat map of event success rates by device/event type
This report helps identify if certain events perform better or worse on particular devices, highlighting opportunities for platform-specific optimization.
Integration with Google Data Studio
For more powerful visualizations and sharing capabilities, connect GA4 to Data Studio:
Creating a GA4 Event Dashboard in Data Studio
Go to Google Data Studio
Click "Create" and select "Report"
Select "Google Analytics 4" as the data source
Connect to your GA4 property
Build your dashboard:
Add charts and tables for event metrics
Create filter controls for interactive analysis
Add calculated fields for custom metrics
Set up regular email delivery to stakeholders
[GUIDED DEMO: Building a GA4 Data Studio Dashboard] Video Description: A 6-minute screencast showing the process of creating a comprehensive GA4 event dashboard in Google Data Studio. The demonstration begins with connecting Data Studio to a GA4 data source, showing the exact steps to establish the connection with proper configuration. With clear cursor movements, the video shows how to add various visualization types (bar charts, tables, scorecards, line charts) to display event data effectively. The demonstration includes creating calculated fields to enhance the analysis, adding interactive filter controls to allow dashboard users to explore the data, and configuring the dashboard layout for optimal presentation. The video concludes by showing how to share the dashboard with team members and set up automated email delivery schedules, with all interface interactions clearly visible and important configuration options highlighted.
Benefits of Data Studio Integration
More visualization options than GA4 offers natively
Interactive controls for deeper exploration
Ability to combine GA4 data with other sources (e.g., CRM data, ad platforms)
Easier sharing with non-technical stakeholders
Automated report delivery
Advanced Event Analysis Techniques
Go beyond basic reporting with these advanced analysis approaches:
Cohort Analysis for Event Engagement
Create a Cohort exploration
Configure cohort settings:
Cohort inclusion: Users who triggered a specific event
Cohort size: Weekly or monthly
Metric: Return rate or event count
Time range: How far back to analyze
This analysis shows how user behavior changes over time after their first interaction.
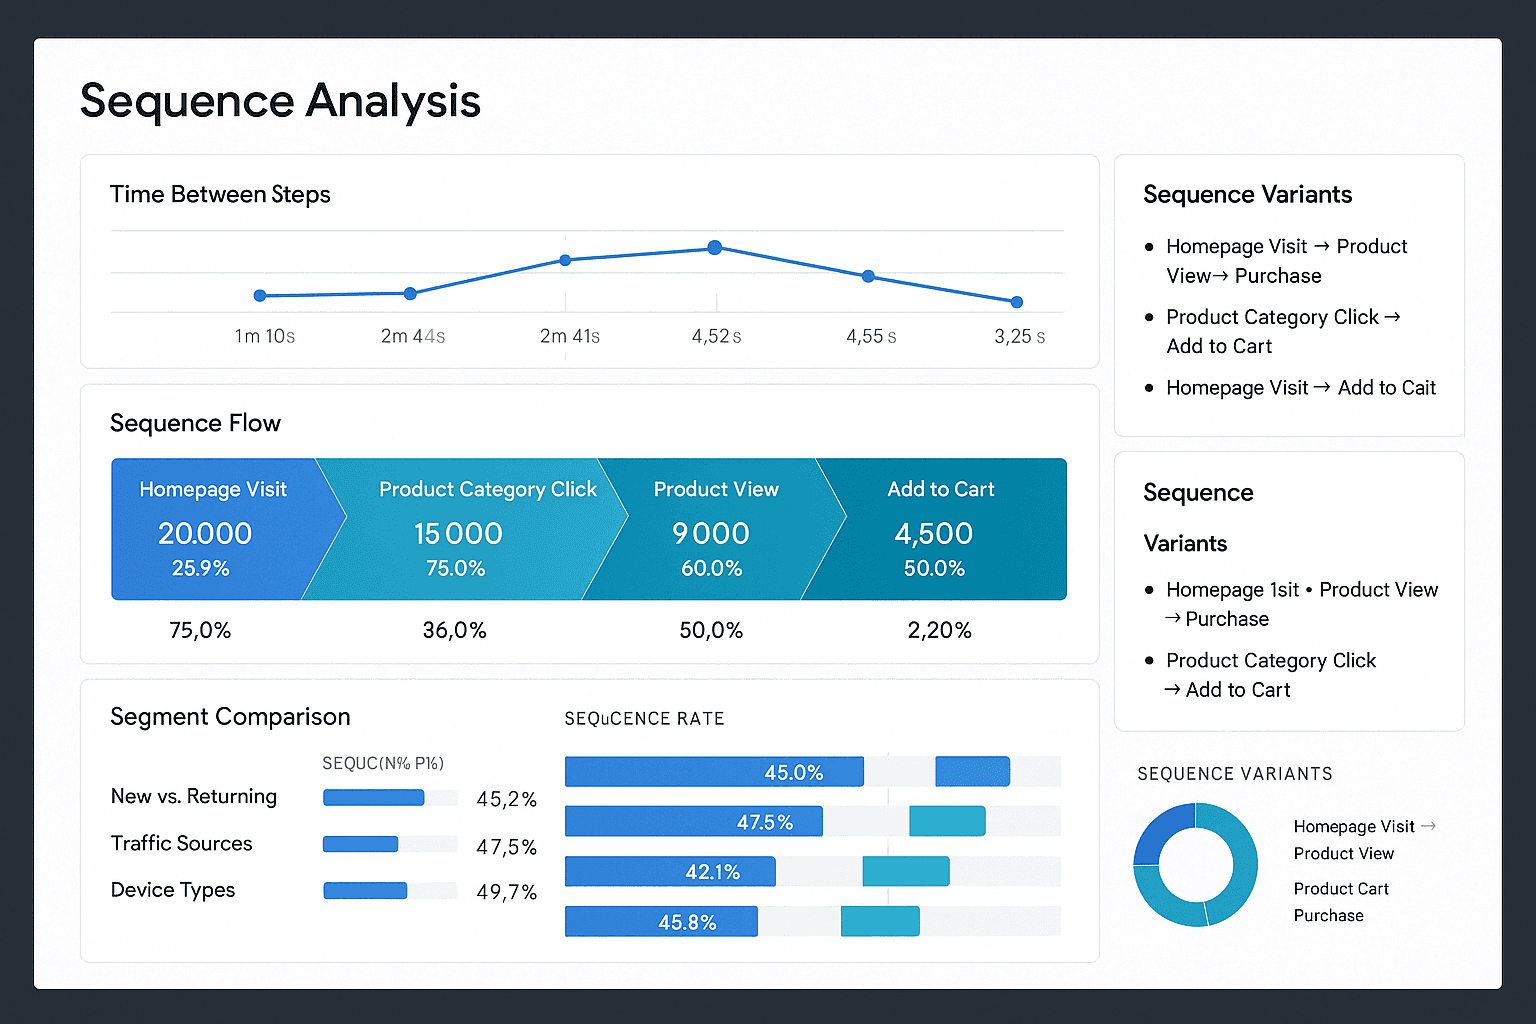
Sequence Analysis for Complex Journeys
Create a Free form exploration
Add sequence segment:
Step 1: First event in sequence
Step 2: Second event in sequence
Etc.
Compare users who completed the sequence vs. those who didn't
Organizing and Sharing Your Reports
Make your insights accessible to stakeholders:
Report Organization Best Practices
Create a logical structure:
Group related reports in collections
Name reports clearly with their main purpose
Include date ranges in report names
Add context:
Include text cards explaining key metrics
Annotate important trends or anomalies
Add business context to technical metrics
Design for different stakeholders:
Executive summaries with high-level metrics
Detailed drill-downs for analysts
Operational dashboards for day-to-day monitoring
Sharing Options
GA4 offers several ways to share your explorations:
Share link: Direct access to the exploration
Export to Google Sheets: For further analysis
Export to CSV: For use in other tools
Schedule email: Regular delivery of reports
Data Studio integration: Interactive dashboards
Implementation Tip: When sharing reports with stakeholders, include a "Key Insights" text box at the top summarizing the most important findings to provide context.
Event Reporting for Different Business Types
Different businesses need different approaches to event analysis:
E-commerce Event Reporting
Focus on product interaction events and conversion metrics:
Product view-to-purchase conversion rates
Category performance comparisons
Cart abandonment analysis
Checkout step drop-off points
Content Site Event Reporting
Emphasize engagement and content performance:
Content consumption patterns
Scroll depth by content type
Social sharing events
Newsletter signup conversion
SaaS Product Event Reporting
Highlight feature usage and user engagement:
Feature adoption rates
User onboarding completion
Retention indicators
Upgrade path analysis
[GUIDED DEMO: Industry-Specific Dashboard Creation] Video Description: A 5-minute screencast demonstrating how to build industry-specific event dashboards in GA4. The video begins by showing three dashboard templates side-by-side (e-commerce, content site, and SaaS product). With clear cursor movements, the demonstration selects the SaaS template and shows the process of customizing it with specific events relevant to a software product. The screencast walks through adding feature usage metrics, creating user engagement visualizations, and building retention analysis reports. Throughout the video, the presenter highlights which metrics and dimensions are most relevant for SaaS businesses and how to arrange them for maximum insight. The demonstration concludes by showing how the same approach can be adapted for e-commerce or content sites by changing the focus metrics, with all interface interactions clearly visible and important configuration options highlighted.
Troubleshooting Event Reporting Issues
Common challenges when creating event reports and how to solve them:
Missing or Incomplete Data
If your reports show gaps in event data:
Check event implementation using DebugView
Verify that custom dimensions are properly registered
Confirm date ranges match your implementation timeline
Check for sampling issues with large data sets
Data Discrepancies
If numbers don't match across different reports:
Compare metric definitions (they may be calculated differently)
Check for filters applied to specific reports
Verify that segments are consistently defined
Look for sampling differences in large data sets
Performance Issues
If reports are slow or timing out:
Reduce date ranges to analyze less data
Limit the number of dimensions and metrics
Apply filters before adding visualizations
Break complex reports into multiple simpler reports
Conclusion and Next Steps
Custom reports and dashboards transform your event data into actionable insights that drive business decisions:
Start with business questions: Build reports that answer specific business questions
Iterate based on feedback: Refine reports based on stakeholder input
Create a reporting schedule: Set up regular report reviews
Document insights and actions: Track decisions made based on the data
Continuously improve: Update tracking and reporting as business needs evolve
For implementation help, check out our other guides:
Learn about the events you should track in our Events You Would Probably Need guide
Understand implementation methods in our Implementing GA Event Tracking with Google Tag Manager guide
Explore advanced techniques in our Advanced Event Tracking Techniques guide
Remember that the most effective analytics approach combines solid implementation, thoughtful analysis, and clear communication of insights to drive business impact.


